
I was reading a blog post about real-time analytics over the lunch today. In it, the author made a claim that "funny business with timeframes can coerce most A/B tests into statistical significance." There's also this plot illustrating two time series of the cumulative number of heads in a two-fair-coin-comparison. Yet, time nor ordering has an effect on test results because each flip is independent. Not content with his claim, I wrote a coin flipping simulation in R to prove him wrong.
This plot shows p-values of proportion tests for two simulated fair coin flips that they are different. Each of these tests are repeated with increasing number of flips per test. Since both coins are fair, we should expect no p-value should dip below our 95% significance level (red horizontal line). Yet we're seeing some false positives (i.e. a claim of evidence when there really isn't) that say the two coins are statistically different.
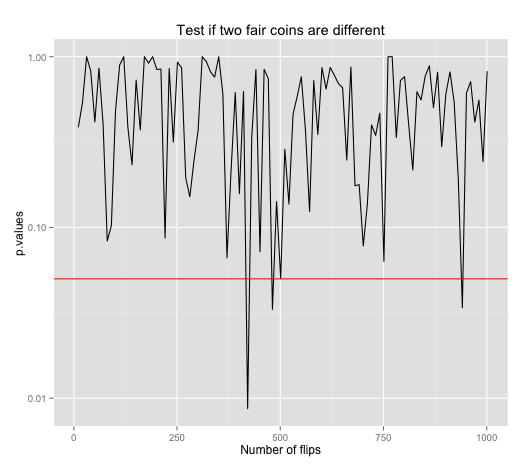
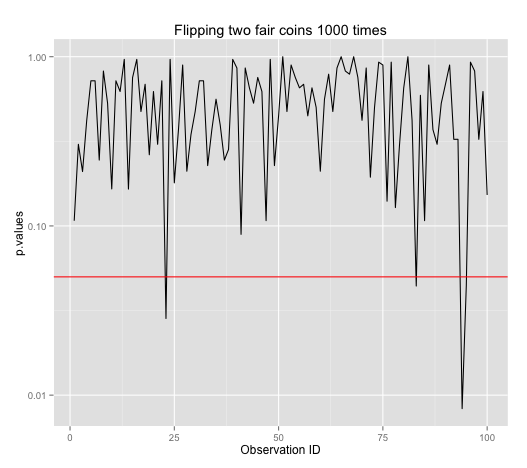
A better illustration is to run a test with 1000 flips, get a test result, and repeat many times for many results. We see that sometimes false positive happens. Given that our significance level is 95%, we can expect false positives to happen 1 in 20 times.
Remembering that I should do a power calculation to get an optimal sample size, doing power.prop.test(p1=0.5, p2=0.501, power=0.90, alternative="two.sided") says N should be 5253704.
So this is a plot of doing many tests with 5253704 flips each.
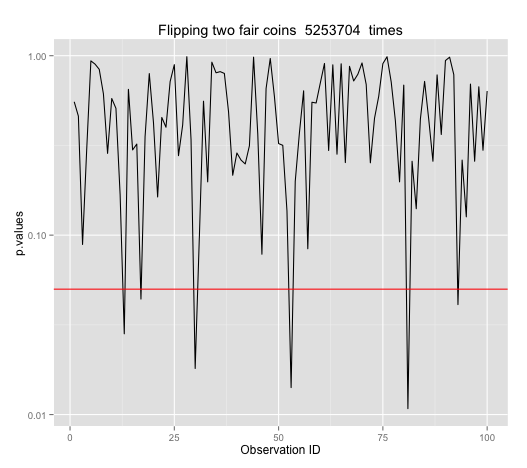
But the false positives didn't improve at all! By now, I'm quite confused. So, I asked for help on StackExchange and received this insight.
What's being gained by running more trials is an increase
in the number of true positives or, equivalently, a decrease
in the number of false negatives. That the number of false
positives does not change is precisely the guarantee of the test.
And so, a 95% significance level remains 95% significant (1 in 20 chance of false positive) regardless of increasing sample sizes as shown. Again.
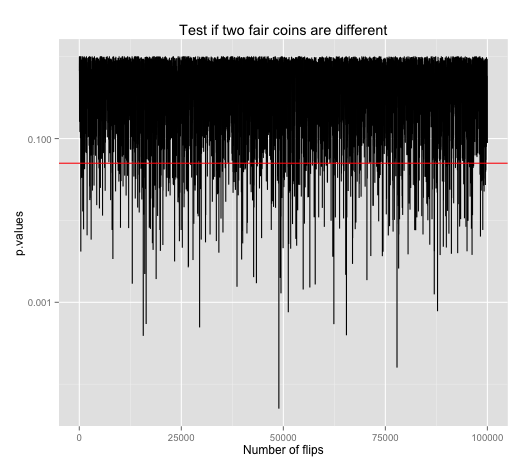
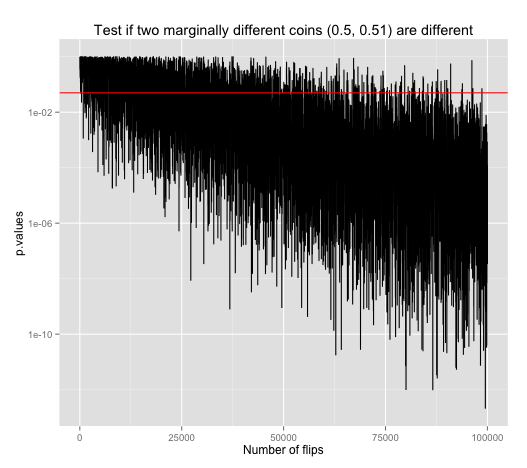
What is, in fact, gained for increasing sample size is reduced false negative, which is defined as failing to make a claim when it is there. To illustrate that, we need a different plot because it is an entirely different circumstance. We have two new coins, and they are different.
Say we have one fair (p=50%) coin and another that's slightly biased (p=51%). This plot shows the result of running the same proportion test to see if these two are statistically different. As we increase sample size, the amount of false negative results, points above the red line (0.05 p-value, 95% significance level) denoting negative results, are clearly reduced as sample size increases. Thus this plot is illustrating that false negatives decreases as sample size increases.
"Funny business" do not coerce A/B tests into statistical significance. The fact that a 95% significance gives 1 in 20 false positives is in fact what it guarantees. To decrease false positive, simply test at a higher significance level. For example, prop.test(c(heads.A, heads.B), n=c(N, N), alternative="two.sided", conf.level=0.99) to set it to 99% instead of the default 95%.
The R source code for this mental sojourn are available at this gist on Github.